Visual Introduction to Green's Functions
Just after finishing my PhD, in the spring of 2018, I was invited to give the first talk of the CIFAR’s quantum materials summer school. I had wanted to craft an introduction to Green’s function for a long time. My slides were really appreciated, so I made this post out of them. Sharing this post is one of the main reasons I put this website together, so don’t hesitate to post your questions in the comments section at the end if you have some.
Disclaimer: this intro is very different from the “standard” presentation of Green’s functions. In particular, knowledge about second quantization is not required. For this reason, my introduction cannot be easily extended to interacting systems, which is the usual reason to work with Green’s function. I recommend two books at the end of this page for a more standard and more complete introduction to the subject.
Why Green’s functions?
My personal reason to bother with Green’s function is because of gaps. Green’s functions are tools of choice to compute and understand energy gaps. Gaps shown in talks and publications are often drawings of gaps, made with paint, PowerPoint, or Keynote. In this post, I will show how to compute an actual gap, using the Green’s functions:
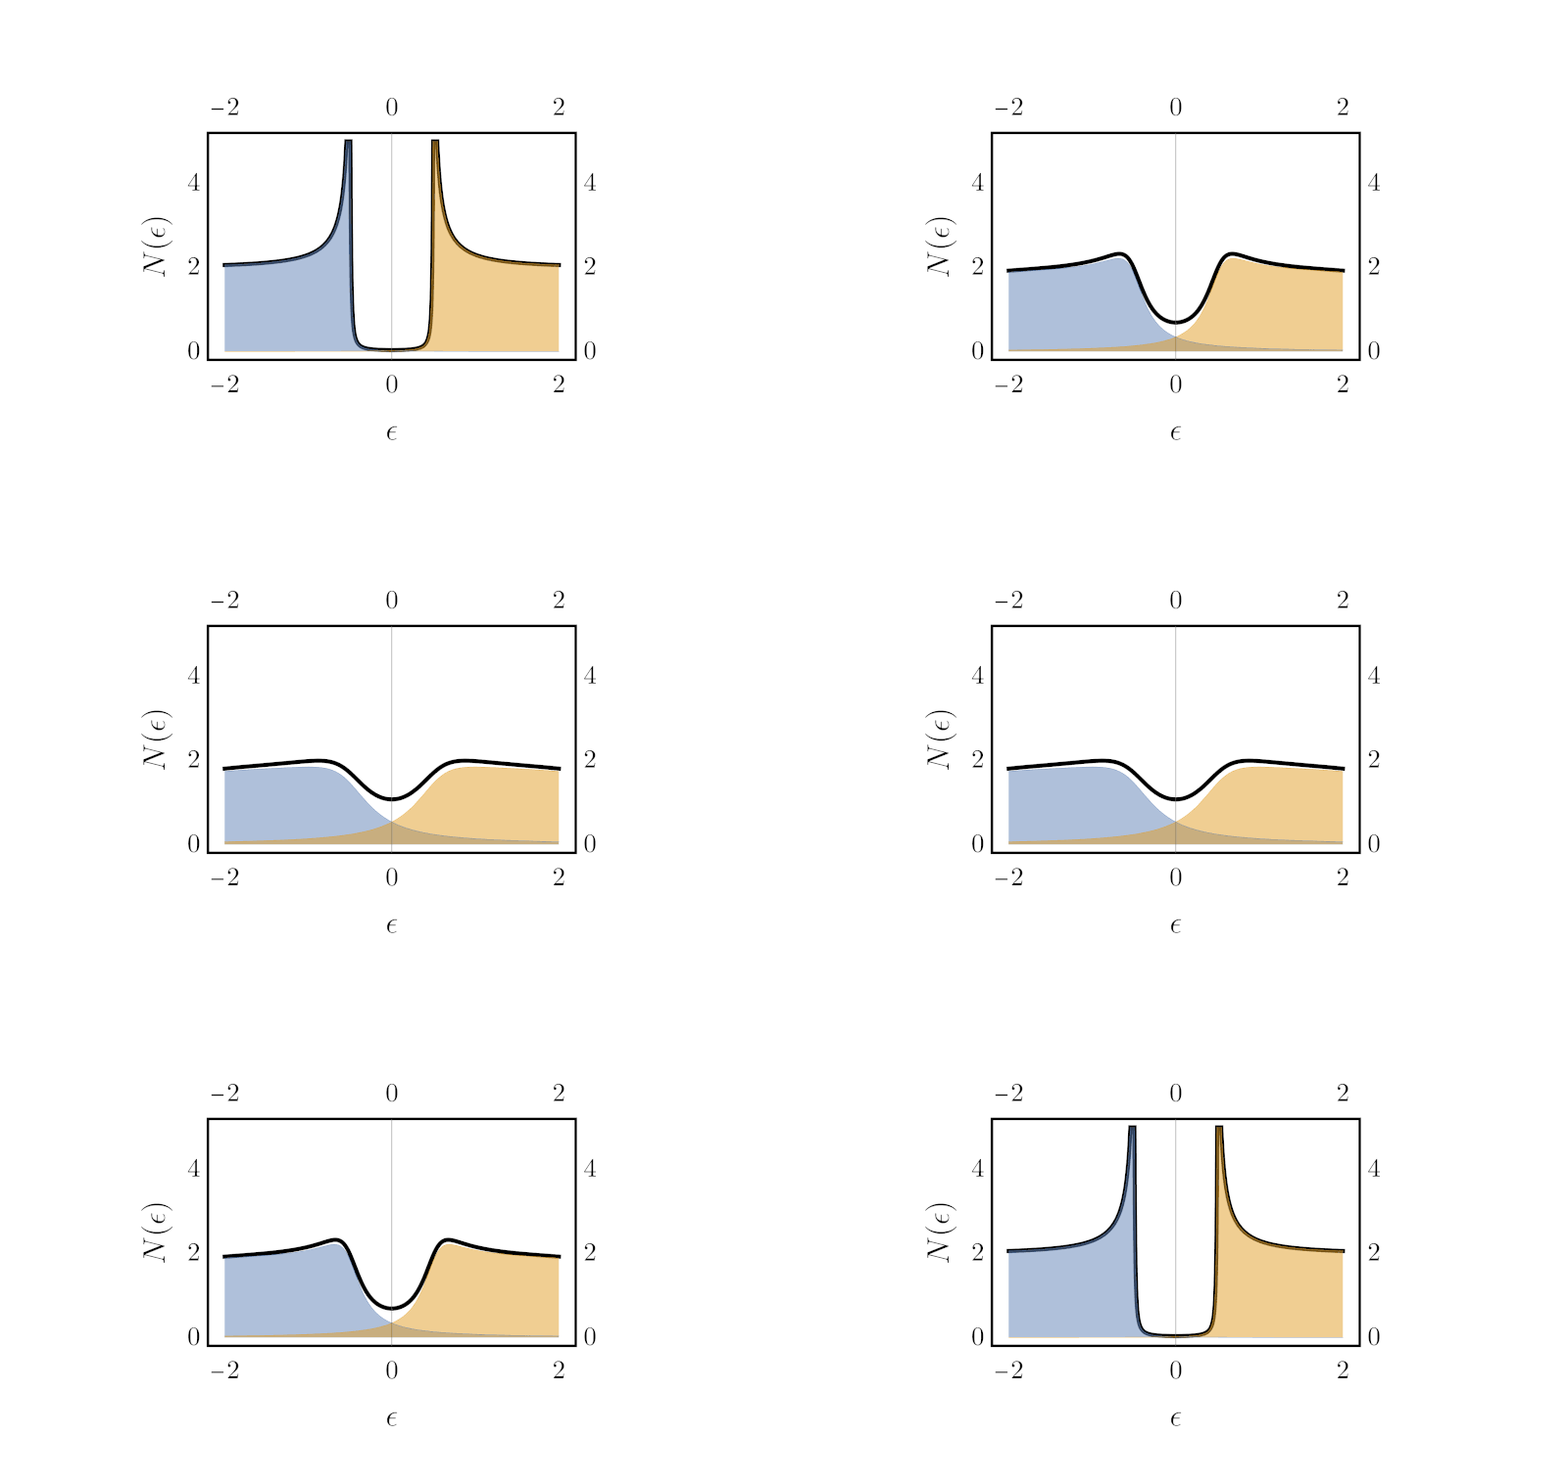
Another reason to bother about Green’s function is because of quasiparticles lifetime. Lifetime is why the above gap dances from sharp (long lifetime) to broad (short lifetime). As you may know, there is an uncertainty principle between time and energy: finite width in energy comes with finite lifetime. As we will see, the particle lifetime is built-in and ready to use in Green’s function.
Ok, show me one!
Let’s start with the Green’s function of the easiest of quantum systems: free electrons. The energies of free electrons are simply given as a function of momentum $\hbar\vec k$, by:
\begin{align} \varepsilon(\vec k) = \frac{\hbar^2}{2m} k^2. \end{align}
This is the dispersion relation of electrons; energy as a function of the wave vector $\vec k$. Without going further, we can write the simplest possible Green’s function:
\begin{align} G(\vec k, \epsilon) = \frac{1}{\epsilon + \text{i}\eta - \varepsilon(\vec k)}. \label{simplestGreen} \end{align}
It is a function of two variables: momentum $\vec k$ and energy $\epsilon$ (or the frequency $\omega = \epsilon/\hbar$ when setting $\hbar=1$). The dispersion relation enters directly in the denominator, and is accompanied by an imaginary term $i\eta$ which we’ll consider in a moment. For now, only notice that because of this imaginary term, the Green’s function has a real and an imaginary part. Therefore, in the one-dimensional case ($\vec k \rightarrow k$), we need two 3D plots to properly illustrate the Green’s function: one for $\text{Re}{G}$ as a function of $k$ and $\epsilon$, and one for $\text{Im}{G}$ as a function of $k$ and $\epsilon$:
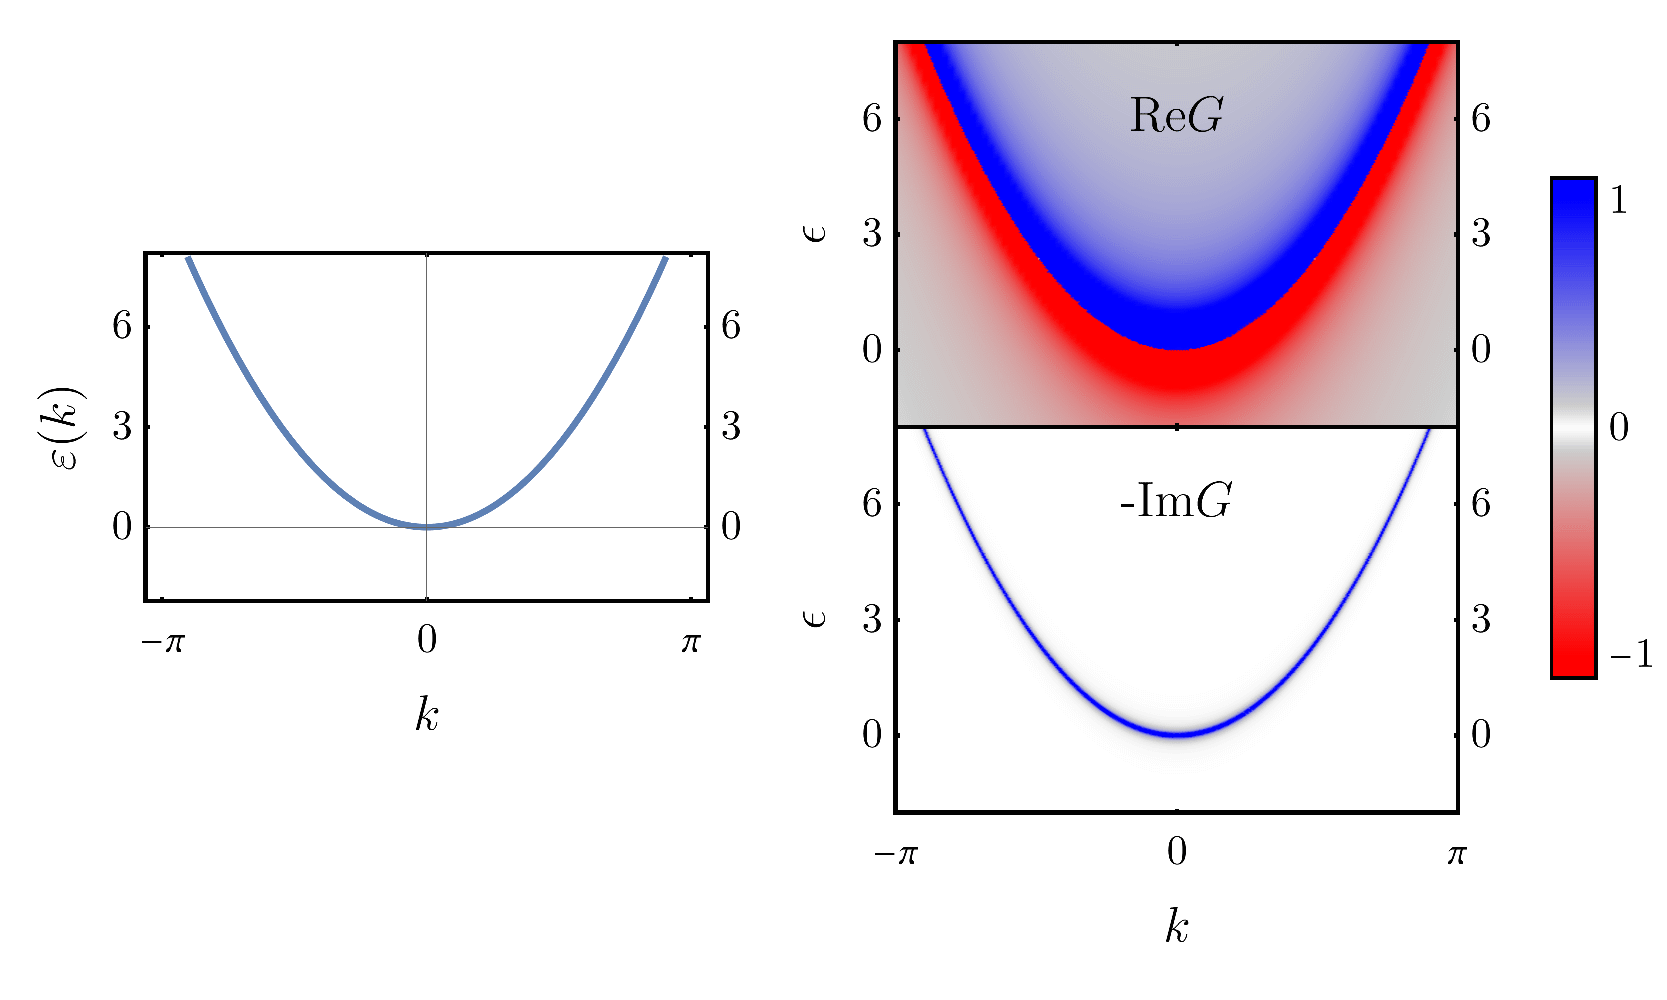
Here, $\text{Re}G$ and $-\text{Im}G$ are plotted as a colormaps, with red for negative values and blue for positive values. This allows to see the equivalence between the energy plot on the left, and $-\text{Im}G$ on the right. You may have heard of the imaginary part of the Green’s function; it is the so-called spectral weight. As you can see, it is only non-zero along the dispersion relation; the spectrum of the system, hence the name. This actually highlights a more general fact: all the main features of the Green’s function happen at the energies of the system.
What about $i\eta$?
Now, what is this imaginary term, with the $\eta$ parameter? Well, you should first know that it is always implicitly going to zero: $\eta \rightarrow 0$. Yet, note that if it were actually zero, $G$ would diverge at $\epsilon=\varepsilon(\vec k)$. In practice, $\eta$ is kept nonzero, and varying its value has the following effect:
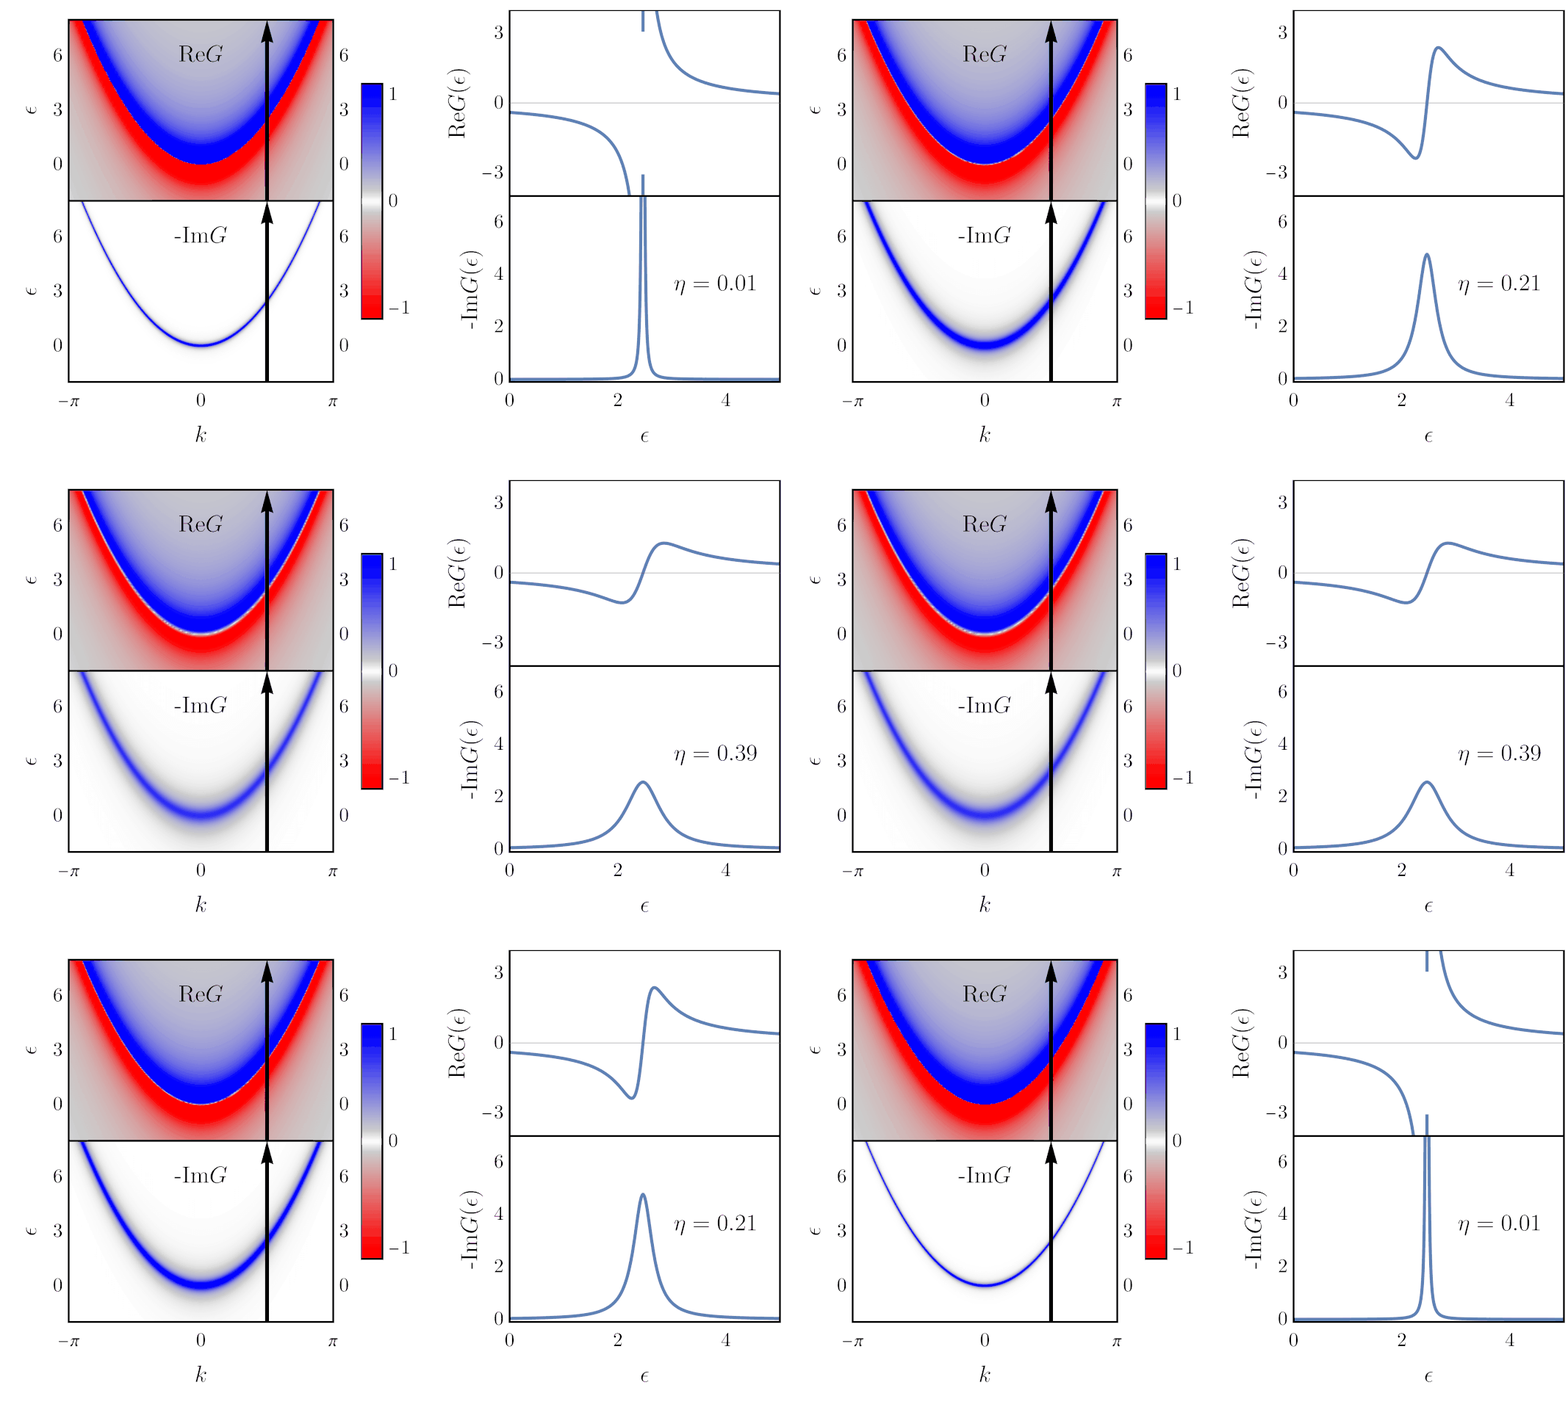
The colorplots on the left are the same as above, and what is plotted on the right are cuts of these colorplots, at $k=\pi/2$, where I added black arrows. Thus, along these arrows, $\text{Re}G$ and $-\text{Im}G$ follow the dependence shown as a function of $\epsilon$ on the right.
This shows that the role of $\eta$ is to broaden the Green’s function in energy. If it was zero, the real part of $G$ would simply be a $1/\epsilon$ divergence, and the imaginary part would be a Dirac delta. (This is an example of the Sokhotski–Plemelj theorem: \begin{align} \lim_{\eta\rightarrow 0}\frac{1}{z+i\eta} \rightarrow \mathcal{P}\frac{1}{z} - i\pi\delta(z), \end{align} where $\mathcal P$ denotes Cauchy’s principal part.) As mentioned earlier, broadening in energy correspond to shorter lifetime. Actually, $\eta$ can be interpreted as an artificial scattering rate. The according lifetime is given by: \begin{align} \tau = \frac{\hbar}{2\eta}. \end{align} This becomes clearer with the actual definition of the Green’s function, as we show next.
Mathematical origins
In general, Green’s functions are a mathematical tools to solve differential equations. In our case (quantum physics), the differential equation is the Schrödinger equation: \begin{align} [i\partial_t - H]\psi(t) = 0, \end{align} where we can identify the differential operator $[i\partial_t - H]$ acting on the time-dependent state. The actual definition of the Green’s function is then: \begin{equation} [i\partial_t - H]G(t,t’) \equiv \delta(t-t’), \end{equation} and the function satisfying this definition is: \begin{equation} G(t,t’) = -ie^{iH(t-t’)}\theta(t-t’). \label{greenDef} \end{equation} As you can see, the Green’s function is defined in the time domain. We must Fourier transform it to the frequency domain ($\epsilon=\hbar\omega$) in order to get the form \eqref{simplestGreen} used in the previous section. However, the definition \eqref{greenDef} is not integrable (because it extends to infinity), and so its Fourier transform is not defined. To circumvent this problem, it is customary to multiply \eqref{greenDef} by an exponential decay $e^{-\eta (t-t’)}$ and take the limit $\eta\rightarrow0$. It then becomes integrable and its Fourier transform is \eqref{simplestGreen}. This is where $\eta$ comes from. This exponential decay in time should clarify why I say the lifetime is “built in” Green’s function. Strictly speaking, the limit $\eta\rightarrow0$ is always implicit, but finite values of $\eta$ are necessary in practice, despite being artificial.
Where are the gaps?
This is all good so far, but where are the gaps I mentioned at the beginning? As far as I know, all gaps encountered in quantum mechanics are different realizations of avoided crossing of energy levels, also known as anti-crossings. This phenomenon is described by the two-level Hamiltonian:
\begin{align}
\boldsymbol{H} =
\begin{pmatrix}
\varepsilon_1 & \Delta \\
\Delta & \varepsilon_2
\end{pmatrix}.
\label{hamiltonian}
\end{align}
Here we take $\Delta$ real. This matrix has eigenvalues $E^{\pm}$ and eigenvectors $\vec v^{\pm}$ (see my earlier post on the two-level system). Let us consider the one-dimensional case with $\varepsilon_1(k) = k$ and $\varepsilon_2(k) = -k$ (to get an easy crossing). The “gap” simply denotes the absence of states between the two eigenvalues:
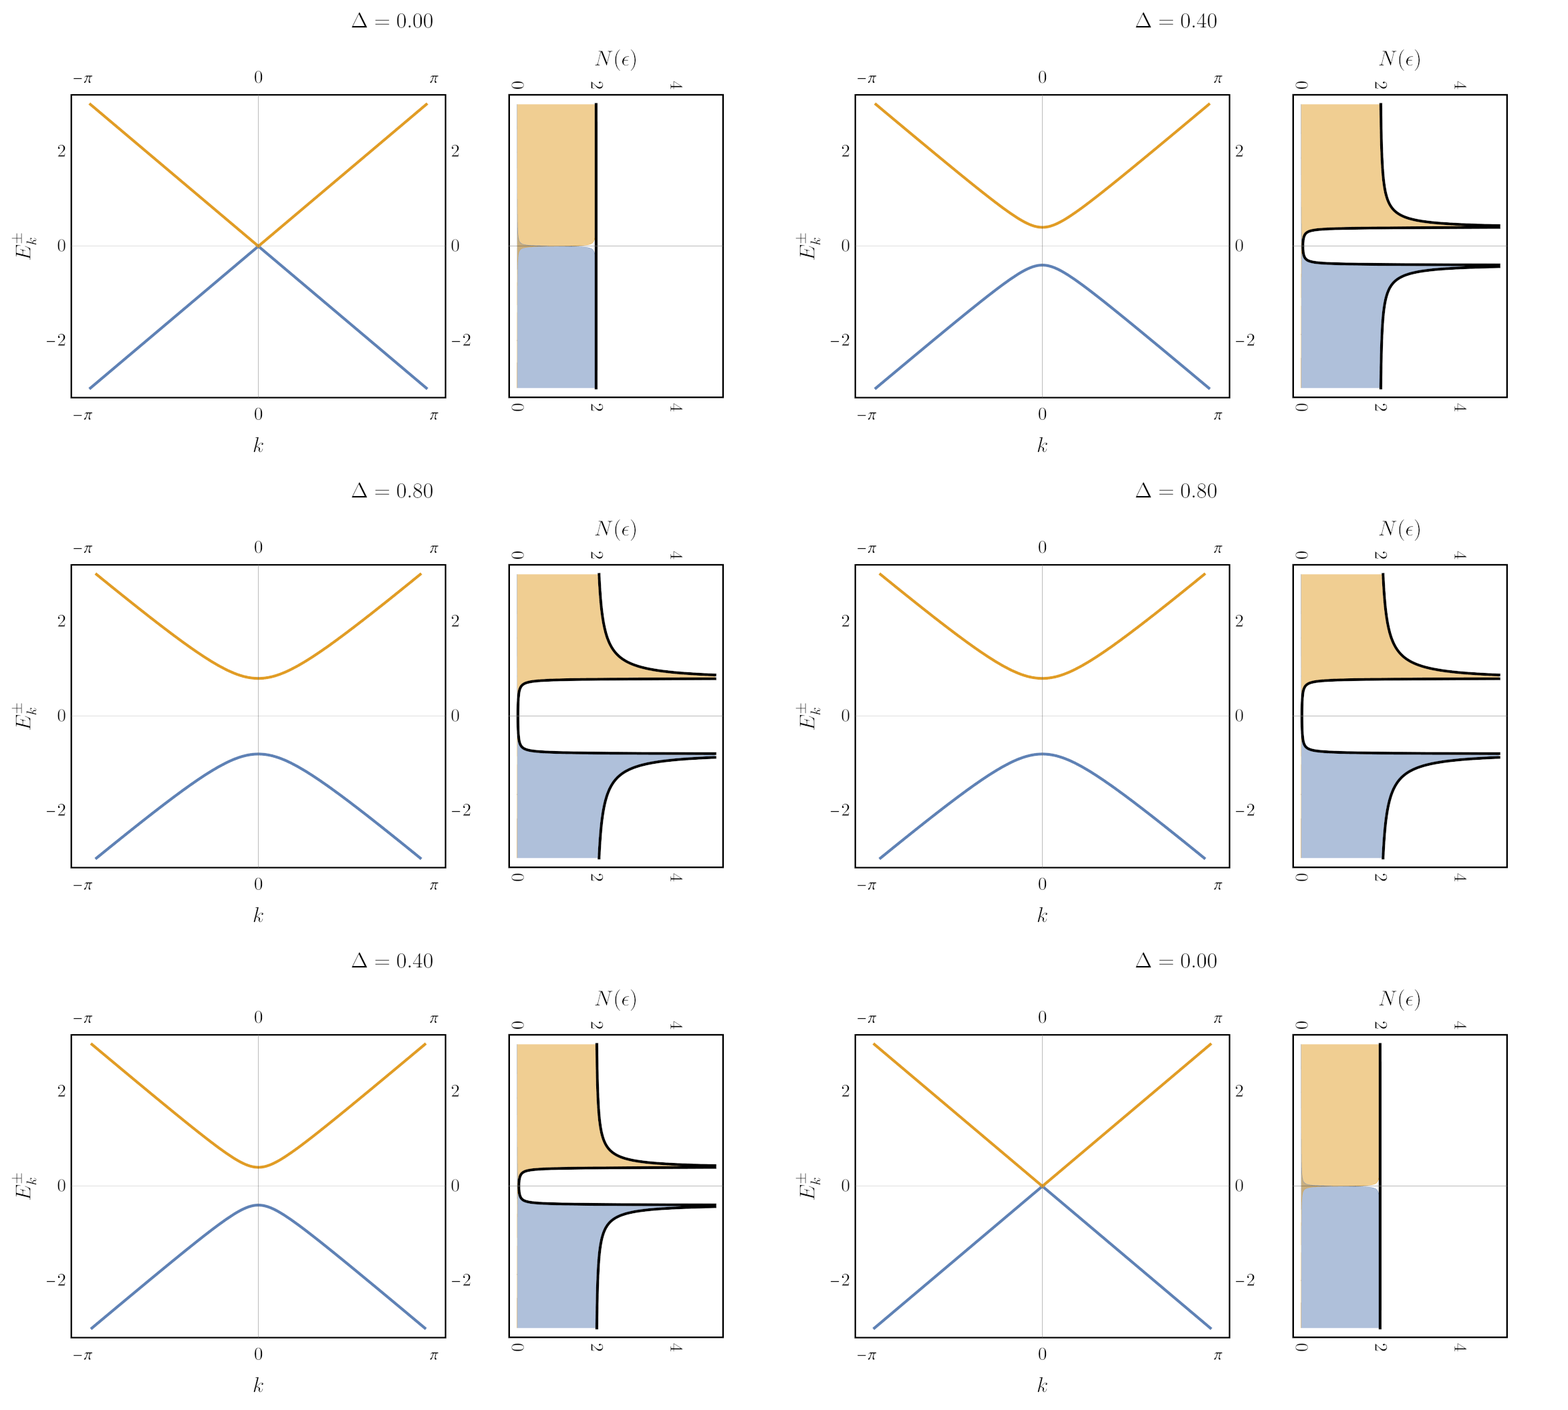
But how do you plot the gap? One way is with to use the Green’s function. The Green’s function of Hamiltonian \eqref{hamiltonian} is given by: \begin{align} \boldsymbol{G}(\epsilon) = [\epsilon + i\eta - \boldsymbol{H}]^{-1}, \label{matrixGreen} \end{align} with bold denoting matrices and $(\epsilon + i\eta)$ implicitly multiplying an identity matrix. That’s right, the Green’s function of the two-level system is a matrix. As a consequence, in the one-dimensional case considered above, we need 8 distinct 3D plots to show all the components of $\text{Re}G$ and $\text{Im}G$. Let’s arrange them in $2\times2$ grids of plots that correspond to the $2\times2$ matrix:
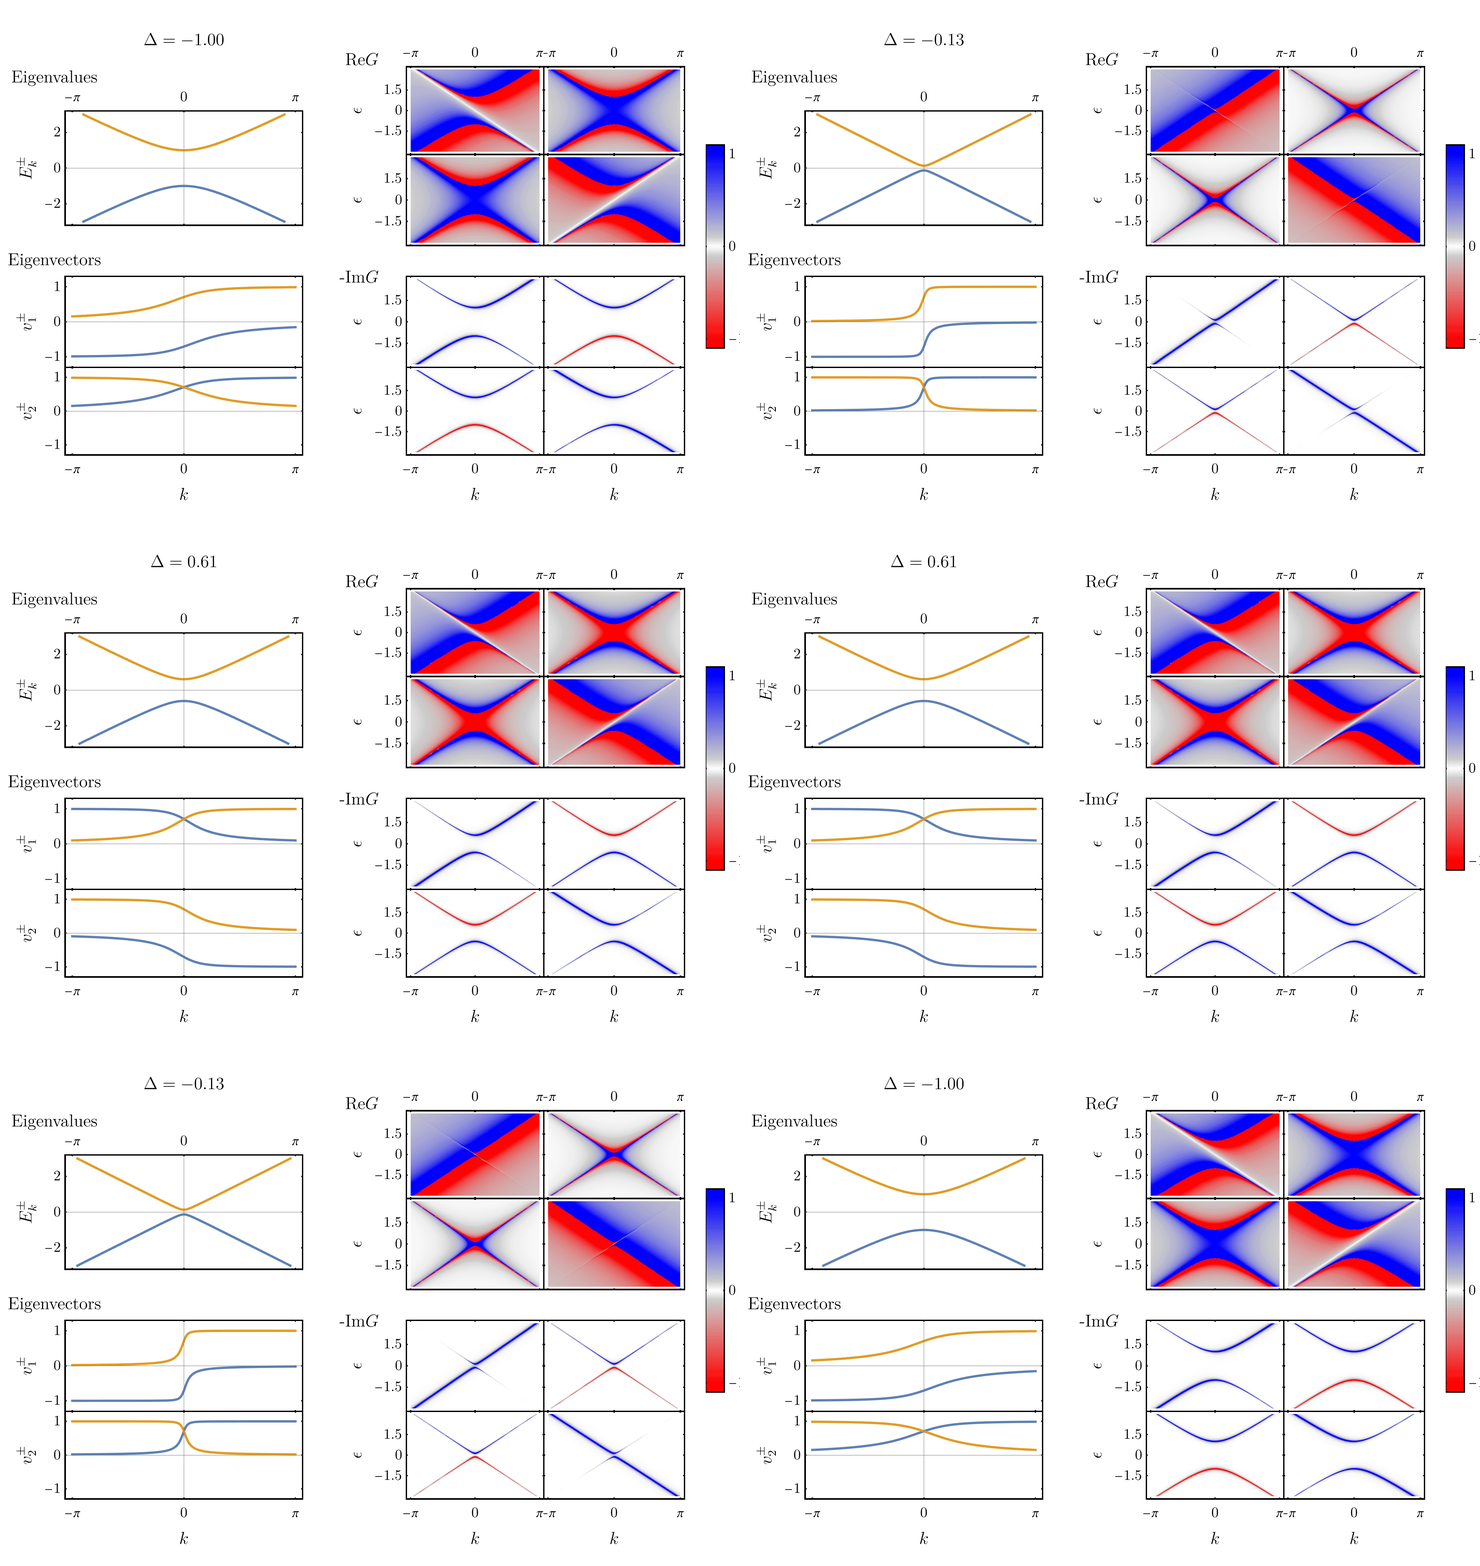
On the left, eigenvalues and eigenvectors are shown, with $\Delta$ varying in time. On the right, the 8 components of the corresponding Green’s function are shown. Three features of the plots are particularly interesting:
- First, the real part of $G$ has divergences at the eigenvalues of the system. This is often stated in another way: the poles of $G$ are the excitations of the system.
- Second, the Green’s function has zeros at the position of the crossing levels. That is: $\text{Re}G_{11}(k,\epsilon)$ (top left colorplot) has zeros (white line) following $\varepsilon_2(k)=-k$, whereas $\text{Re}G_{22}(k,\epsilon)$ has zeros following $\varepsilon_1(k)=k$.
- Third and finally, the spectral weight ($-\text{Im}G$) is only non zero at the eigenenvalues $E^\pm(k)$. Furthermore, when the gap is non-zero, the relative amplitude of ($-\text{Im}G$) on each eigenvalues varies as a function of $k$. We can show that this variation is determined by the coefficients of the eigenvectors.
\begin{align} -\text{Im}\boldsymbol{G}(\epsilon) &= -\text{Im}\big\{ \boldsymbol{U}^{\dagger} \big[(\epsilon + i\eta) - \boldsymbol{E}\big]^{-1} \boldsymbol{U}\big\} \end{align} \begin{align} -\text{Im} G_{i,j}(\epsilon) &= -\text{Im}\big\{ \sum_{n} U^*_{n,i}\frac{1}{\epsilon + i\eta - E_n}U_{n,j}\big\} \end{align} For $G_{i,i}(\epsilon)$, rationalizing the denominator yields: \begin{align} -\text{Im} G_{i,i} &= \sum_{n} |U_{n,i}|^2 \frac{\eta}{(\epsilon - E_n)^2 + \eta^2} \\\ &= \sum_{n} |U_{n,i}|^2 \pi \delta(\epsilon-E_n), \end{align}
where we used the equivalence between the Dirac delta function and a Lorentzian of zero width, $\pi\delta(x) = \lim_{\eta\rightarrow0} \eta/(x^2 - \eta^2)$. Going back to the $\pm$ notation, the last line reads:\begin{align} -\frac{1}{\pi}\text{Im} G_{i,j}(\epsilon) &= |v^+_i|^2\delta(\epsilon-E^+) + |v^-_i|^2\delta(\epsilon-E^-) \end{align}
- First, numerical algorithms do not control the order in which they output the eigenvalue-eigenvector pairs. This typically leads to discontinuities as a function of $k$, and as a function of $\Delta$, especially with large matrices. Here Mathematica does a very good job of keeping the same order from $k$ point to $k$ point, but changes the order abruptly at $\Delta=0$.
- Second, even in the same order, the eigenvectors of an Hermitian matrix are only defined modulo a phase, which could change from one $k$ point to the other or from one gap to the other. Here we avoid such difficulties because the matrix is real.
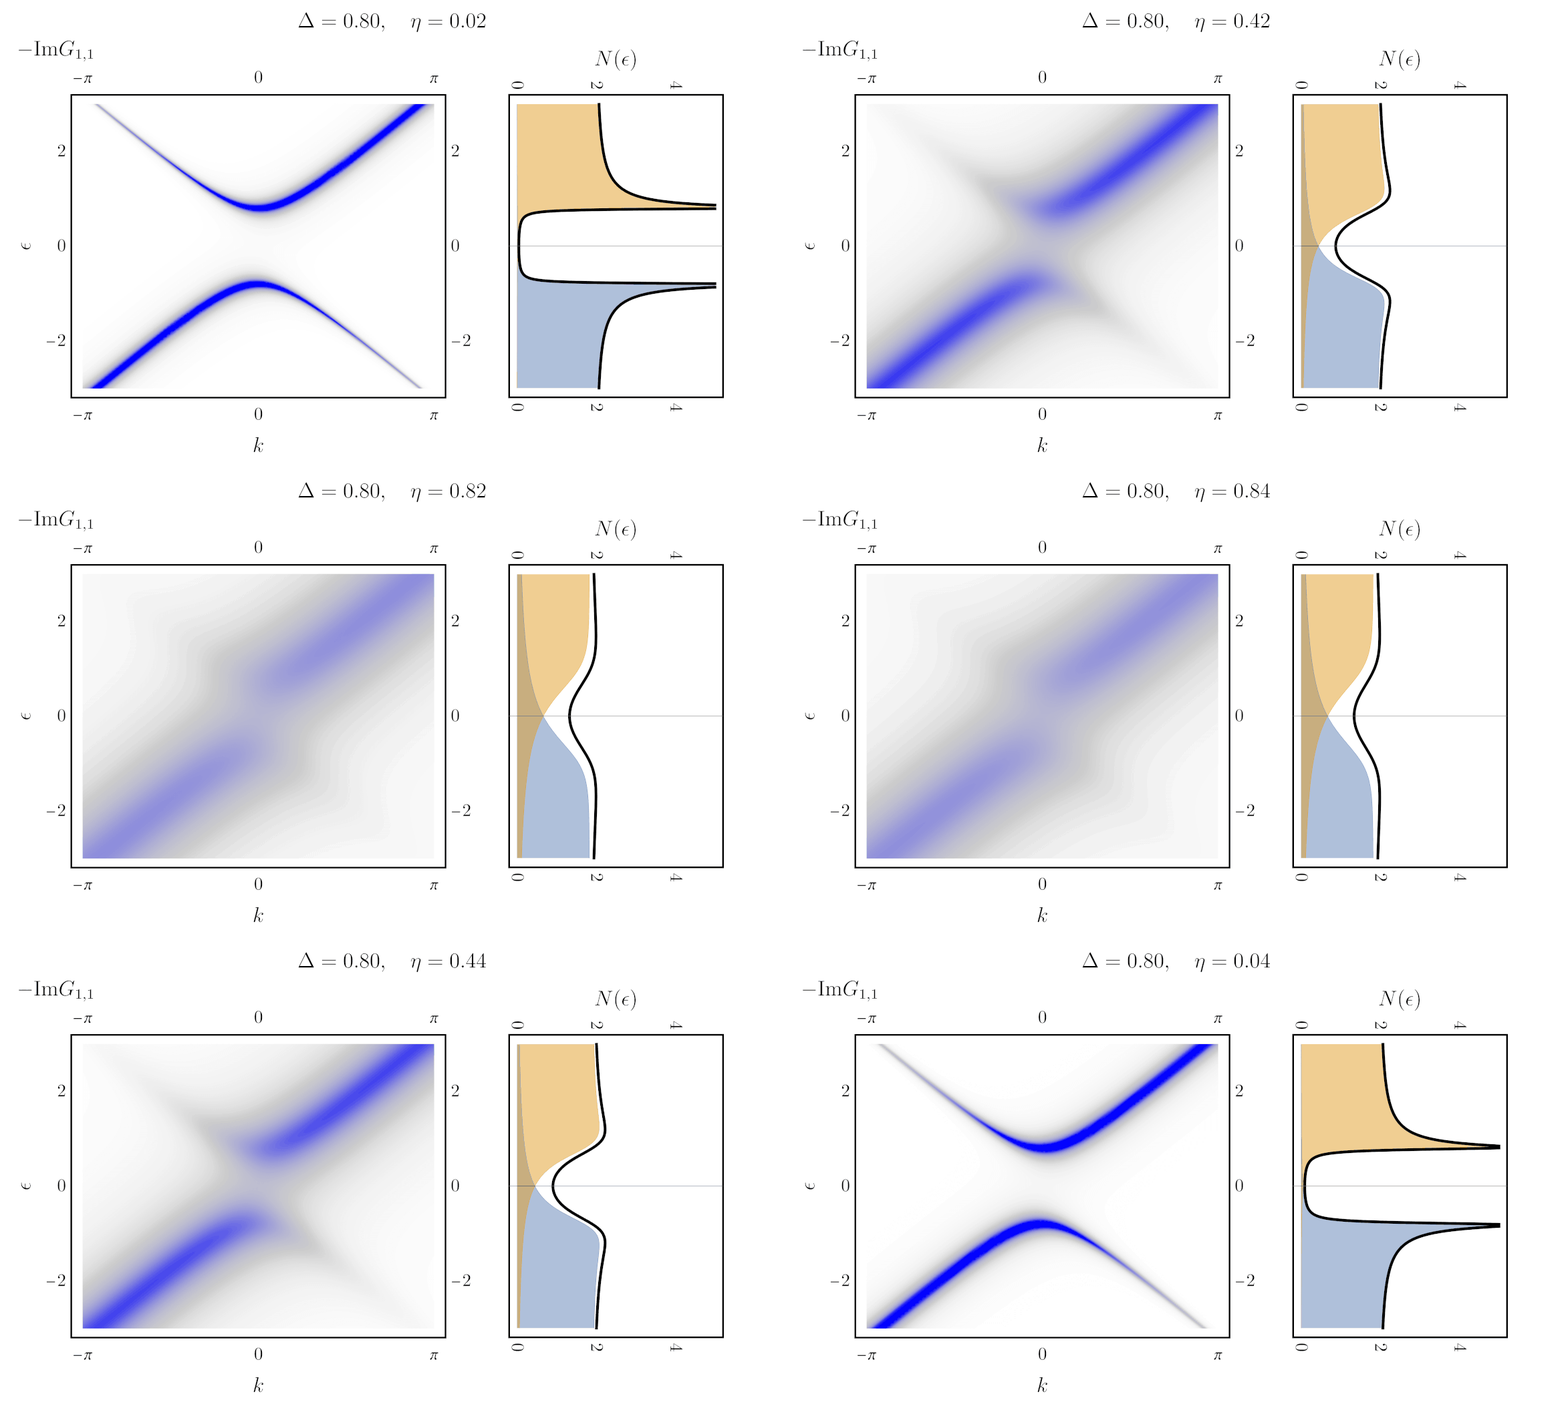
Finally, to compute the gap, one can simply integrate the imaginary part of the Green’s function (the spectral weight) over $k$. Doing so counts all the state weight at a given energy. Using the definition \ref{matrixGreen} even yields an expression for the density of state directly in terms of the Hamiltonian:
\begin{align} N(\epsilon) = \int dk \Big[-\frac{1}{\pi}\text{ Im}\big\{[\epsilon + i\eta - \boldsymbol{H}(k)]^{-1}\big\}\Big]_{1,1} \end{align}
Here is the result (right), next to the unintegrated spectral weight (left), with eta varying in time:
Is that all there is to it?
What I presented here is so “elementary” that I don’t even think it can be found in textbooks. Green’s functions are usually used to treat many-particle systems (many electrons in interaction). Here, I have not even mentioned interaction, nor temperature. For a fun, engaging, and more complete introduction on Green’s functions, I strongly recommend Richard Mattuck’s A Guide to Feynman Diagrams in the Many-Body Problem. For a more conventional introduction (with all the mathematical details), consider Fetter & Walecka Quantum Theory of Many-Particle Systems. These two are classics, but there are many others.